

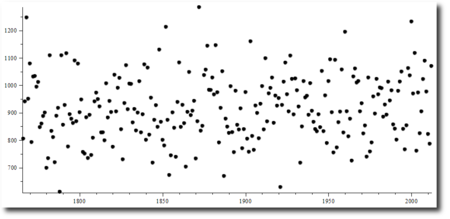
The above is a graph (hopefully now showing…apologies, but was OK when posted originally) plotted using rainfall data from as far back as 1766 by Doug Keenan(via Bishop Hill). It doesn’t show any particular change in present rainfall patterns from those experienced since 1766.
The Data is from the Met. Office’s Hadley climate centre...which boasts….
An independent review of the Met Office Hadley Centre commissioned by Defra and the MoD in 2007 concluded that:
‘It is beyond dispute that the Met Office Hadley Centre occupies a position at the pinnacle of world climate science and in translating that science into policy advice.’
Looking at the graph it is apparent that there is a pattern to the rainfall….every 50 years or so the rain falls more frequently in the middle range…starting at the beginning of the century, building up slowly and then dying away towards the end of the 50 year period…..anyone looking at that might speculate that we are now in a period when the rain should be getting heavier…..if it followed a pattern shown over two centuries or more.
Funnily enough that seems to be the case.
What is confusing is that the Met Office has another data set for rainfall….which I presume is the one they used in press releases recently as it dates only from 1910….the rainfall recorded is different to the Hadley data.
The BBC quote these figures from the Met. Office:
Met Office: 2012 was UK’s second wettest year on record
Top five wettest years in the UK
1. 2000 – 1,337.3mm
2. 2012 – 1,330.7mm
3. 1954 – 1,309.1mm
4. 2008 – 1,295.0mm
5. 2002 – 1,283.7mm
(Source: Met Office)
I’m not certain how the Met. Office calculate the UK totals...or even which data set they actually use but using the Hadley data for England and Wales I can show you how easy it is to cherry pick ‘record rainfall’ figures to emphasise any assertion about climate change that you fancy.
The BBC report that April and June have been the wettest April and June on record…indeed they have.
But what about the rest of the months in England and Wales?
When was the wettest January ? 1948. February? 1833. March? 1947. May? 1782. July? 1828. August? 1912. September? 1918. October? 2000. November? 1852. December? 1876.
When was the wettest month on record? November…1852.
Wettest month in Scotland? January 1993.
Wettest month in Northern Ireland? December 1999.
When was the wettest year on record? 1872, followed by 1768.
Which decade was the wettest on record? It was not 2001-2010…it was in fact 1871-1880. 1991-2000 was wetter than 2001-2010. (I haven’t calculated every decade…..merely picked what looked as if it would be high totalling and calculated from there….so there may be an even wetter decade….point being …the wettest decade is definitely not 2001-2010)
So you can see just throwing up ‘record’ figures is highly misleading….it certainly is slightly wetter than average at the moment but look again at that graph….and that might be entirely ‘normal’ in that pattern….we might in fact be due even heavier rainfall in the next decade or so. …only for it to dry up again.
So when the BBC busy themselves quoting these ‘scare’ figure which are designed to convince us that the world is about to end just consider that the records show things were just as bad, if not worse over a century ago…well before the IPCC claim our use of fossil fuels etc resulted in a change of climate, mostly in the last 50 years.
The Mayans predicted 2012 would finish with the end of the World…the BBC predict a similarly dire end.
The Mayans were wrong…..The BBC seem similarly to be in the sway of a religious fervour that clouds their judgement and prevents their journalism from functioning properly, stopping them digging out the truth rather than just accepting press releases from groups and organisations with vested interests….. The BBC are happy to suggest that because April and June were the wettest on record we can conclude that unusual and disasterous climate change is upon us…whilst the figures suggest otherwise…..any climate change might be entirely normal…and even beneficial for many.
Whatever the truth of the figures it might do to question them a bit more and look back into history for a few lessons and a broader perspective.
It’s been raining in the UK.
News? Not really. Oddly it’s been raining in the UK, and the populous complaining about it for centuries.
It’s just another item to keep weather in the news and the population sensitized to it. It has as much credence as the blathering of Prince Charles.
Aren’t the met office still campaigning for a bigger and faster computer so they can forecast their inaccuracies quicker?
Prince Charles is still box office for the dfs sofa crowd, if Sky’s fawning over ITV’s fawning interview is anything to go by, with a bunch of slow news press in complement. That he is a poster boy for not being dysfunctional without any media cranking at least one eyebrow in irony shows how ratings will trump credulity with the MSM any day.
yep, time to stop worrying about what is essentially plant food, get out the factor thirty, and concentrate on considering factors such as excessive building, re – the water table, how about new reserviors? with this all this “excessive” erm rainfall eh and solve future “drought” issues to boot .. these are of course practicalities.
just goes to show you can easily doctor anything with figures, just look at those for employment.
The graph doesn’t show for me – not sure if it’s a bad link or something in my settings.
Same here. Not found. By the way, Anthony Watts thinks he has evidence (and he is VERY thorough) that the NCDC (National Climatic Data Centres) has a set of figures for public use and a set of figures for private use.
http://wattsupwiththat.com/2013/01/06/does-noaas-national-climatic-data-center-ncdc-keep-two-separate-sets-of-climate-books-for-the-usa/
Regardless of this, James Hansen of NASA’s GISS has also been caught cooking the books, changing recorded temperatures to better reflect the CAGW myth.
http://stevengoddard.wordpress.com/data-tampering-at-ushcngiss/
Check your cookie settings?
The link is wrong. Have posted correct link above
I’ve got a prediction; come the summer we’ll have a fortnight of sunshine, there will be more blathering about global warming and Boris will hit us with a hosepipe ban.
There will be a ‘drought’ this year.
All those new millions of people have to drink something.
Doug’s graph (incorrectly linked to above) can be found in this article
http://www.bishop-hill.net/blog/2013/1/5/england-and-wales-rainfall-trends.html
Link is to the data used for the graph…the graph is linked to ‘via Bishop Hill’
‘Whatever the truth of the figures it might do to question them a bit more’
Lord Patten, Hugs etc, don’t seem keen, and have the limitless unique FoI exclusion budget to enforce it.
forgive my befuddled brain but are the BBC coming up with the top 5 years for rainfall as being
1. 2000 – 1,337.3mm
2. 2012 – 1,330.7mm
3. 1954 – 1,309.1mm
4. 2008 – 1,295.0mm
5. 2002 – 1,283.7mm
rather than 1872 and 1768 as being the wettest years simply because they are using their “special” set of data ?
‘using their “special” set of data ?’
I was going to suggest more ‘unique’, like so much else, but as you mention a ‘special’ kind of special…
‘I know it’s wrong but…’
It`s cherry picking alright, but not as we know it here I suppose.
Just listened to twenty five minutes of TWatO , where the “news and comment” seemed curiously slanted and aimed at fomenting more trouble in London, but less in Belfast.
1. For the likes of Kearney, giving us “analysis and comment” did not extend to telling us why the Alliance etc have chosen to remove the Union flag…these riots there seem to be “just unacceptable”-no matter what the “provocation” or “signals sent”…things the BBC usually like to include by way of excuse( but only when it suits…these unionist types are clearly the “wrong rebellion”…Boo!)
2. Contrast this with some Red Cross Frenchman being continually trying to explain any coming riots in Britain with “unfairness/injustice/poverty/youth unemployment yada yada”.
To be fair, the bloke tried to be cautious-but then parallels with the glorious Arab Spring came up, and poor Martha was salivating at the prospect….this would be a “good rebellion”-as Greece went, Spain does…let`s hope Cameron gets a bit more of those youthful escapades of August 2011 was the clear message from Martha.
So then- the riots we currently have are bad…white trash who think they`re British and not buying in to Adams or Blair…boo?
Now the ones we might get if the BBC could make the red Cross report better known, with that classic Guardian ooze added..these would not be about better widescreen, trainers or booze…no sirree…they`ll be due to IDS or Osborne, and their callous cuts.
Remember August 2011…did Mark Duggan die in vain?…let`s ask Laura, Owen, Paul Mason or Polly…
Plenty widescreens, booze, drugs and the like up Camillas kaftan there by Radio Salford lads!…
The Mayans did not predict the end of the world. Their calendar cycle ended and started anew. The media hyped it up and plenty of charlatans took advantage of people over it, and media outlets like the BBC got to milk it for all it was worth anyway.
But are you sure it didn’t end?
Could what you are experiencing now be your own personal Hell. Maybe you weren’t that naughty in the last world and what you see now is more of a rebuke than a punishment.
Prove me wrong! ;p
There’s a fascinating piece by Matt Ridley on his blog suggesting that satellite data is now clearly indicating the planet is actually ‘greening’ thanks to very slightly raised CO2 levels in the Earth’s atmosphere.
Far from bringing about the ‘Great Catastrophe’ for so long promised with gleeful enthusiasm by warmist zealots, quite the reverse appears to be happening – CO2, the stuff of life itself, is doing just what it does best – feeding the world’s forests and jungles and in the process helping to provide habitats for species everywhere.
Somehow, I doubt we’ll ever hear about this well-documented scientific fact (it’s all there on the link) the BBC any time soon.
Sadly, kids are being taught that CO2 is a pollutant.
This is not really surprising. If there wasn’t a negative feedback loop for every variation of climate change then the earth long ago would have frozen up or become too hot due to a runaway greenhouse effect – purely due to random fluctuations being exacerbated.
The climate ‘models’ still assume strong positive feedback, which is what the alarmist predictions of up to 6 deg C rise by the end of this century are based on. Guess what? It’s not happening.
See 4th video down in this link:
http://www.climate-skeptic.com/climate-videos2
Yes – and the explanation is what we in the trade call a ‘fiddle factor’!
“If the facts don’t fit the theory change the facts” (attrib A Einstein)
Spot on! If you look at the Climategate e-mails the very small clique of scientists – and there is not a statistician amongst them – who are are being allowed to drive the agenda on global warming are constantly trying to find or fiddle data to fit their theory, despite what real world evidence is telling them.
Click to access climategate-emails.pdf
I read this paragraph fully on the topic of the resemblance of latest and preceding technologies,
it’s amazing article.
Stop by my blog; vind ipad